
Embedded debugging
CoreSight on Cortex‑M: Debugging Without Touching Application Code
What the hardware reveals and how much confidence a trace capture deserves

The fault only happens at the customer site. Add a log and it disappears; set a breakpoint and the timing changes enough to hide it. Embedded developers know the pattern.
Many Cortex‑M microcontrollers contain useful measurement hardware. Arm groups these debug and trace components under CoreSight. Depending on the chip, they expose memory accesses, exceptions, or program flow without rebuilding firmware.
The qualifier is depending on the chip. “Cortex‑M” guarantees neither DWT, ITM, ETM, MTB, nor a usable trace output. The core configuration, MCU integration, permissions, routing, probe, and decoder determine what a capture proves.
CoreSight is not a single block
CoreSight is modular: debug access, trace generation, transport, and storage are separate jobs. A simplified arrangement looks like this:
Debug access
Probe ── SWD or JTAG ──> Debug Port ──> Access Port ──> core, memory,
                                                        CoreSight registers

Instrumentation and events
DWT hardware events ────┐
                        ├──> ITM packet path ──> SWO or trace infrastructure
ITM software messages ──┘

Program flow and system trace
ETM ─┐
STM ─┴──> ATB ──> funnel/replicator ──> TPIU + trace port or TMC sink

Local program trace
MTB ──> reserved SRAM buffer ──> read later through debug access

Trigger control, not data transport
CTI/CTM ──> start, stop, and cross-trigger signals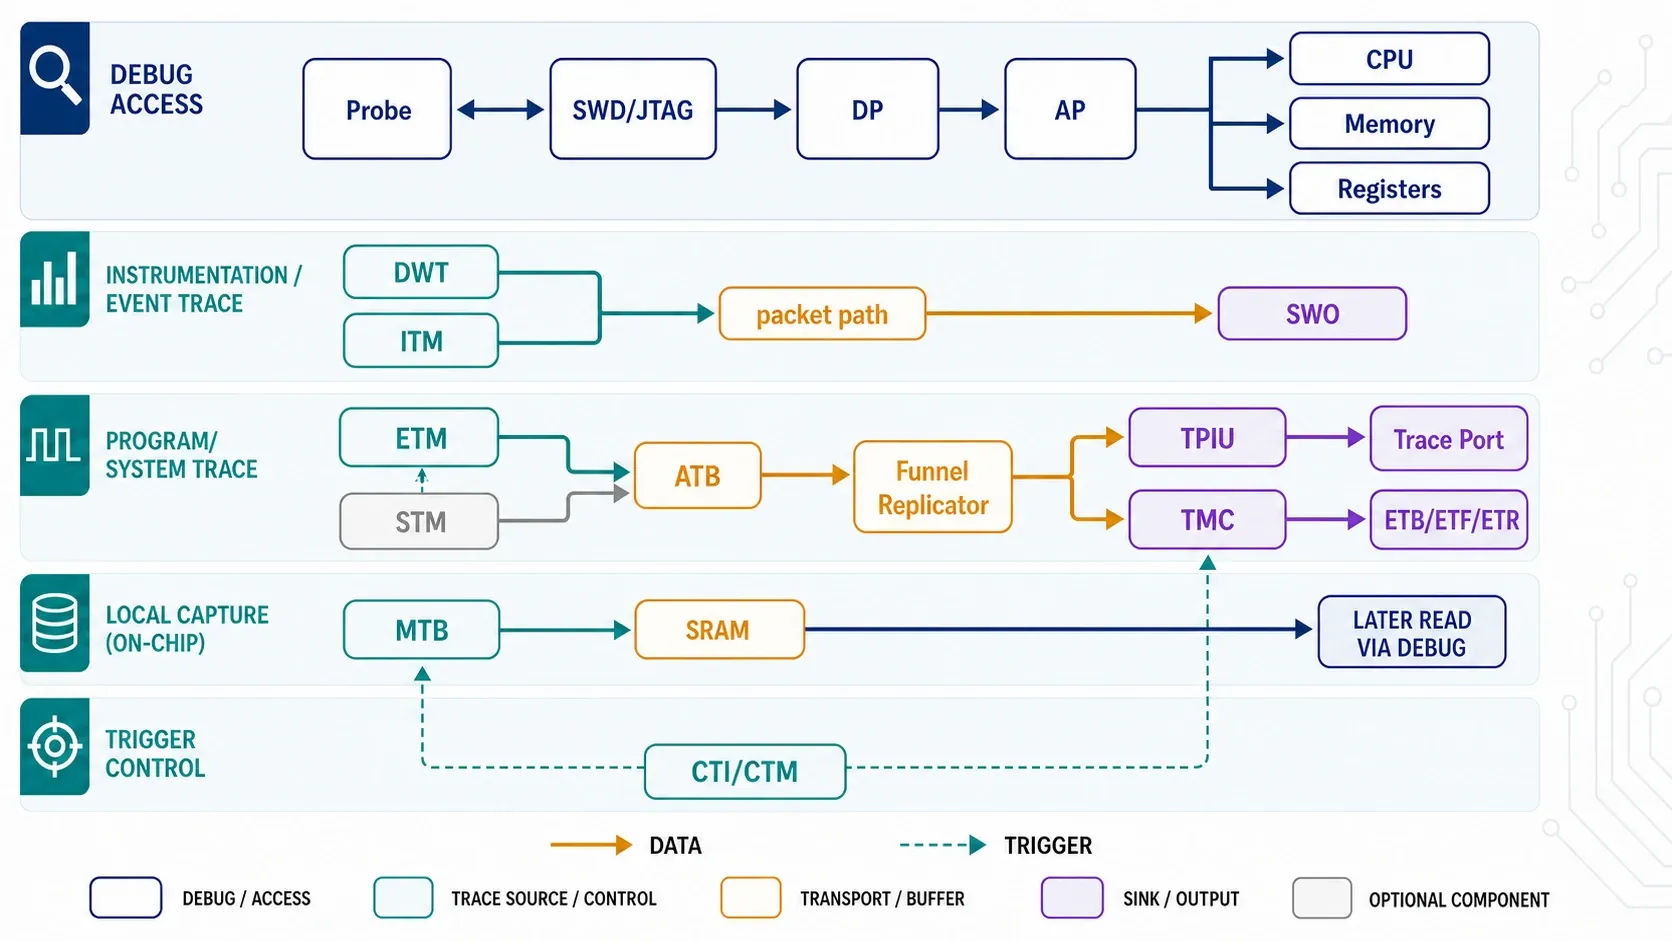
Figure 1: Debug access, trace data, and cross-trigger control use distinct paths. The actual MCU integration determines which blocks exist.
This is not a schematic for every MCU. Crucially, SWD, SWO, and a parallel trace port are not interchangeable. SWD or JTAG connects the probe to a Debug Access Port (DAP), made up of a Debug Port and Access Ports. It provides access to the core, memory, and CoreSight registers. SWO is a serial trace output; a parallel trace port is a separate, wider output.
CoreSight trace components fall into three groups:
- Sources generate trace. The DWT may provide watchpoints, selective data trace, PC sampling, exception events, and profiling counters. The ITM carries software messages; DWT packets can use the same packet path. The ETM produces compressed program-flow trace. An optional STM adds system-wide instrumentation trace.
- Links connect sources and destinations. Over ATB, funnels merge streams and replicators distribute them. CTI/CTM carry triggers, not trace data.
- Sinks capture or output trace. These include SWO, a TPIU, and on-chip buffers or memory destinations. A Trace Memory Controller (TMC) can be configured as ETB, ETF, or ETR.
The MTB (Micro Trace Buffer) sits apart from that pipeline. It writes non-sequential flow changes to limited SRAM, which the tool reads later through debug. MTB is not a continuous stream.
What must a Cortex‑M manufacturer implement?
No particular CoreSight debug or trace block must appear in every Cortex‑M chip. CPU and NVIC properties and architectural conformance do not guarantee usable trace. Public Arm data sheets describe several cores with configurations that omit debug or trace.
Architecture and examples Publicly documented design space Practical consequence General Components are modular, and the permitted feature set depends on the selected core. “Cortex‑M” alone guarantees no DWT, ITM, ETM, MTB, SWO, or trace port. Armv6‑M: Cortex‑M0/M0+ M0 and M0+ have documented minimum configurations without debug; MTB is optional on M0+. Even breakpoints and watchpoints are not assured by the core name alone. Armv7‑M/Armv7E‑M: Cortex‑M3/M4/M7 M3 and M4 offer configurable debug and trace levels. M7 offers reduced or full watchpoint/breakpoint sets; ITM/DWT trace and ETM may be absent. DWT, ITM, TPIU, and ETM must not be assumed across the family. Armv8‑M: Cortex‑M23/M33 On M23, DWT watchpoints are configurable and ETM/MTB are optional. M33 offers minimal, reduced, and full debug variants; ITM/DWT trace, ETM, MTB, and CTI are configurable. Security features and a modern core name do not automatically mean “full trace.” Armv8.1‑M, for example Cortex‑M55 On M55, DWT, ITM, and ETM are among the configurable features. The core data sheet and the specific MCU reference manual remain authoritative. Architecture rules. Conditional rules apply once components are integrated: an Access Port with debug components requires a discoverable ROM table hierarchy. Merged trace sources need unique trace IDs and formatting. This governs the selected feature set; it does not make that set universal. See CoreSight Basics: Discovery and CoreSight Basics: Trace.
Licensing limits. Legal entitlement also depends on the Arm license, Bill of Materials, and Integration and Implementation Manual. These are not fully public, so MCU data sheets cannot establish other manufacturers’ contractual duties.
What it can observe
Halting, single-stepping, breakpoints, and register or memory access are invasive debug operations. They require implemented, reachable, and authorized hardware. Security or lifecycle states may restrict or disable them.
Trace captures events while the core runs. “Non-halting” still does not mean “zero-impact”: trace consumes clock and power, polling creates bus traffic, and ITM software messages cost instructions.
Who overwrote this variable?
A DWT comparator can, where supported, match an address or range and emit trace for an access. The hit proves that access occurred; instruction address, data address, and value fields depend on DWT version and configuration. Few comparators and varying packet modes make this a test of one hypothesis, not a recording of all memory traffic. A halting watchpoint is also distinct from a non-halting trace event.
What happened during the latency spike?
Supported exception packets report entry, exit, or return and can expose an unexpected interrupt sequence. Exact durations require trustworthy timestamps or a known time base. Timestamps, cycle information, and a shared time base are optional; without synchronization there is no exact global timeline.
Where does the CPU spend its time?
PC samples are statistical hotspot clues, not complete call histories or exact timing. They also do not prove RTOS task switches. That requires a scheduler event such as task_switch or targeted observation of pxCurrentTCB; the switch boundary and selected task identity remain separate claims.
ITM, ETM, and MTB answer different questions
ITM carries structured software events or printf-style output. It is efficient, but remains instrumentation.
ETM produces compressed program flow, reconstructed with the exact code image. A mismatched ELF, modified RAM code, overlays, or uncaptured dynamic changes corrupt the result. ETM neither transmits every opcode nor guarantees lossless capture.
MTB keeps a limited SRAM window. After wraparound, only the current window remains; there is no continuous streaming or unlimited history.
Cross-trigger and system-wide trace become available only if the chip integrates additional CTI/CTM or STM components. Those capabilities do not follow from the Cortex‑M name either.
Present, accessible, and usable are three different things
A data-sheet check mark is only the beginning. Trace can fail elsewhere:
- The block exists, but its output is not pinned out, packaged, or routed on the board.
- Lifecycle state, TrustZone, or authentication limits or disables access.
- Clock or power gating makes the component unreachable in certain operating states.
- The required sink, transport, or capable probe is missing.
- SWO bandwidth, internal FIFOs, or the probe cannot keep up. Packets are lost, a buffer wraps, synchronization breaks, and only sections remain decodable.
- Streams from several sources do not have an automatically exact temporal order without a common time base.
- Polling and trace configuration change clock, energy, or bus behaviour. Non-halting does not mean zero-impact.
- ETM data is valid only for the code that actually ran. A similarly named or subsequently rebuilt ELF does not establish identity.
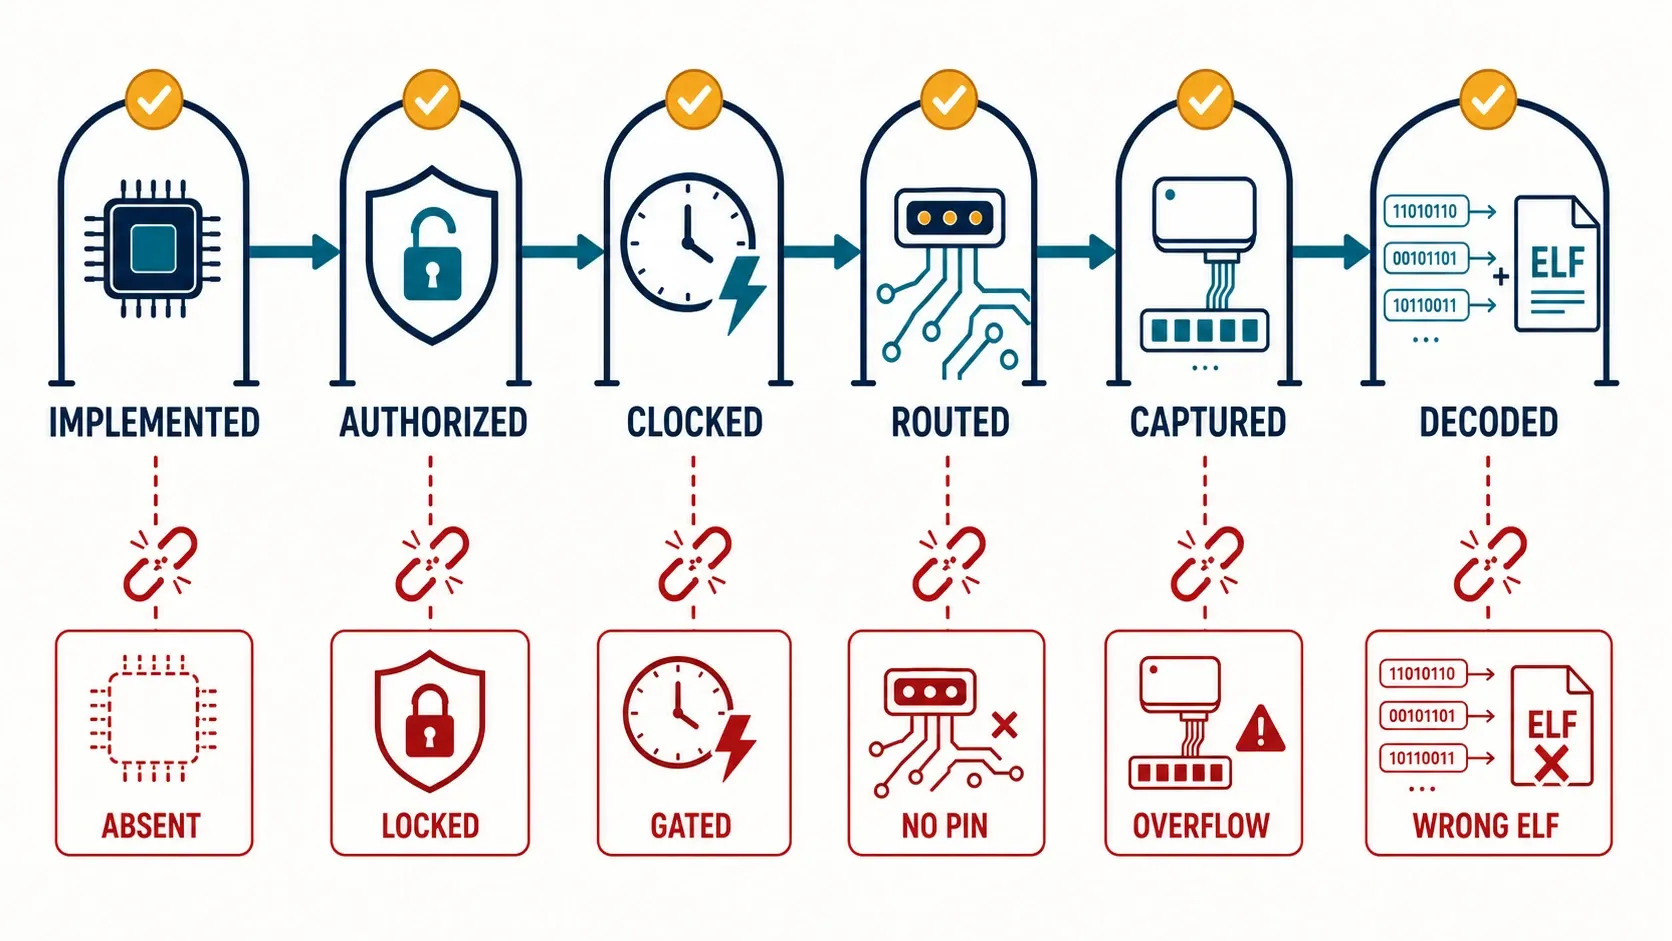
Figure 2: “Present in silicon” is only the first link. Authorization, clocks, routing, capture, and the matching ELF must also be correct.
These limitations belong in the result. A partially decodable capture can still be useful, but it must not be presented as a complete timeline.
From discovery to defensible evidence
Instead of promising “full trace” immediately, build an evidence chain in small steps:
| Level | What this level proves | What it does not yet prove |
|---|---|---|
| Discovery | The probe reaches the target; accessible components and feature registers were read. | That any trace output, sink, or decoder works. |
| Debug and polling | A register, memory value, or PC was observed at specific polling instants. | Continuous execution, exact transitions, or the absence of intermediate events. |
| Raw SWO data | Bytes reached the probe through the configured serial path; raw data and loss indicators can be retained. | That the stream is complete, synchronized, and correctly attributed to a DWT or ITM source. |
| DWT/ITM | A supported DWT event or deliberately generated ITM message was decoded correctly. | That all data accesses, exceptions, or task switches are present. |
| MTB | The retrieved SRAM buffer contains reconstructable program-flow information for its capture window. | Live streaming, unlimited history, or ETM capability. |
| ETM | The verified ETM path and matching code image allow execution to be reconstructed in valid capture regions. | That unmarked gaps are complete, or that every probe and Cortex‑M MCU supports instruction trace. |
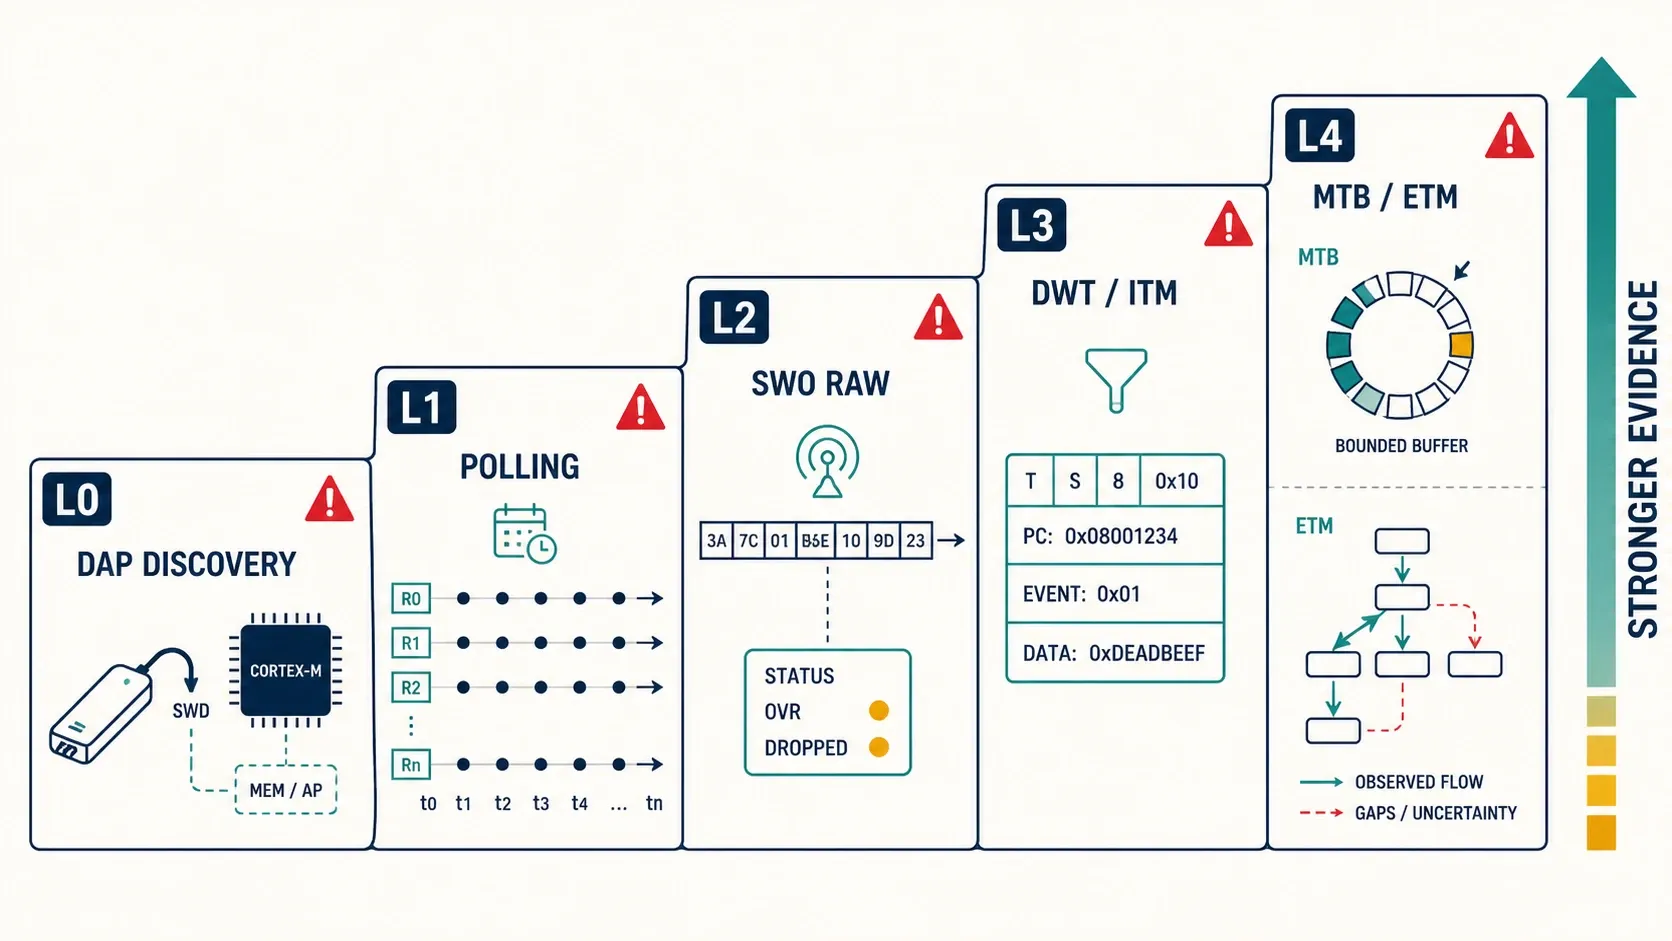
Figure 3: Every level provides stronger but still bounded evidence. No level turns lost or unobserved events into a complete timeline.
Each level needs raw bytes or buffer contents, configuration registers, clock assumptions, overflow and synchronization status, and firmware identity. Only the matching ELF turns addresses into symbols or DWARF records; Build ID, hash, memory ranges, and Thumb-bit handling help catch mismatches.
A detected probe proves only its connection. A valid packet establishes transport, correct decoding establishes the event, and known loss bounds are required for completeness claims.
Why the effort is worthwhile
CoreSight does not replace every log or breakpoint. It helps when added code changes the behaviour: data corruption, interrupt storms, latency spikes, and race conditions.
The best capture starts with one question: which hardware event confirms or disproves the hypothesis? A verified path, retained raw data, and visible gaps turn a timeline into engineering evidence.
Our firmware development on target hardware page explains how we support low-level software from architecture through testing. For formal checks of distributed runtime data, the TRACE research project takes a complementary approach.
Arm sources and starting points
- Understanding Trace
- CoreSight Basics, part 1: components and access types
- CoreSight Basics, part 2: discovery and ROM tables
- CoreSight Basics, part 3: trace topologies
- The different DAPs
- Cortex‑M0 Processor Datasheet
- Cortex‑M0+ Processor Datasheet
- Cortex‑M3 Processor Datasheet
- Cortex‑M4 Processor Datasheet
- Cortex‑M7 Processor Datasheet
- Cortex‑M23 Processor Datasheet
- Cortex‑M33 Processor Datasheet
- Technical Introduction to Cortex‑M23 and Cortex‑M33
- Cortex‑M55 Processor Datasheet